
Changsin Lee l Tech Evangelist l Testworks
Did you know that traffic counting is behind the rise of Microsoft and thus modern personal computing? Traffic counting is used by city officials to determine transportation needs. The most popular method is by laying a strip of pneumatic rubber tube on the roadway of interest and analyze metrics like vehicle volume, vehicle types, axle counts, etc. This method, however, is not quite accurate or safe so a better method is researched. In this article, you will find how you can build your own traffic counter using a Deep Learning approach (YOLO V5) using a public dataset from the ground up. The entire source code is available in the Colab notebook. The sample training dataset used is AI Hub dataset number 30743 which Testworks delivered as a public dataset.
Problems
Interestingly, before they founded Microsoft, Bill Gates and Paul Allen first tried their hands on automating some manual processes in punching in the pneumatic road tube data. The business partnership was named as Traf-O-Data which later became Microsoft. While the project itself was not very successful on its own, the experience they gained eventually led to founding Microsoft and the rest is history.
Though pneumatic rubber tube counters are easy and widely used solutions, there are a few problems:
- Setup risks: To set up the tubes, someone has to go out in the middle of a high-traffic roadway. This is risky and poses an insignificant amount of liability issues.
- Wear-and-tear: Rubber tubes invariably suffer from natural wear-and-tear and thus need to be replaced on regular basis. A more sinister problem is that the device might start reporting inaccurate metrics without people realizing it.
- Inaccuracy: A bigger problem is that the metrics that can be gathered from pneumatic tubes are rough guestimates at best. Vehicle speed and traffic conditions can all contribute to inaccurate measurement.
- Scalability issues: While the tube provides a simple method of counting, if you want to gather other information like pedestrians, cyclists, motorists, models of vehicles, etc., there is simply no way the pneumatic rubber tubes can scale up.
For these reasons, a safer and more scalable method is sought after in the field of Computer Vision, especially Deep Learning. The key to a good performing Deep Learning model is, of course, quality training data. The good news is that there are many publicly available free datasets. In what follows, I am going to show how you can enhance the performance of a traffic counting model through transfer learning on public data. For the experiment, a sample surveillance camera dataset from AI Hub Korea. There are 100 images taken from a fixed point surveillance camera and they were tagged with bounding boxes.
Baseline Model: YOLO V5
YOLO (You Only Look Once) is an open-source Deep Learning system that is used successfully used for object detection. There are also pre-trained models from which you can train with your own dataset. This is called ‘transfer learning’ and a good way to bootstrap your own vehicle detection system. To do so, let’s get YOLO V5 together with the pre-trained model.
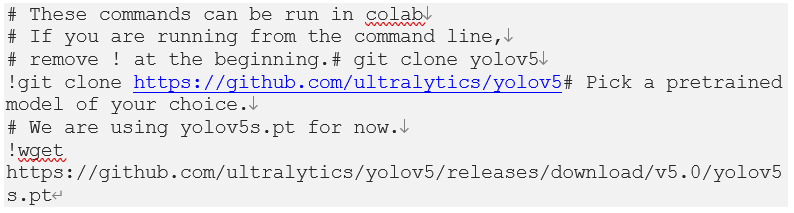
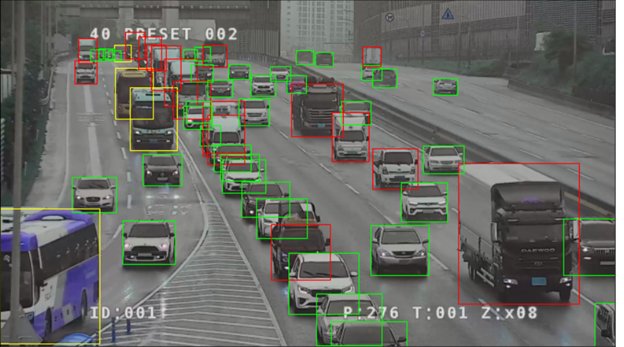
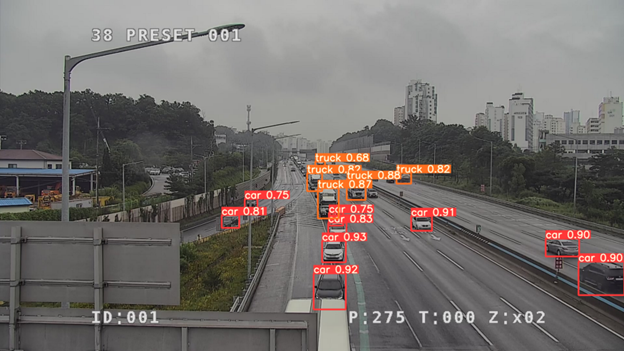
Now get some test image data and run through the model. You are welcome to use any images but since we are interested in traffic data, let’s grab some images from a highway surveillance camera here and then run the detect command to obtain yolov5 predictions.

Detailed descriptions of what each command line parameter means can be found in the yolov5 repository. For our purposes, we just need to specify the weights file (weights parameter), image size (img parameter), confidence threshold (conf parameter: 0.5 means that the confidence probability should be at least 50%), and the source folder where the test images are located (source parameter). Here is sample output from the detection:
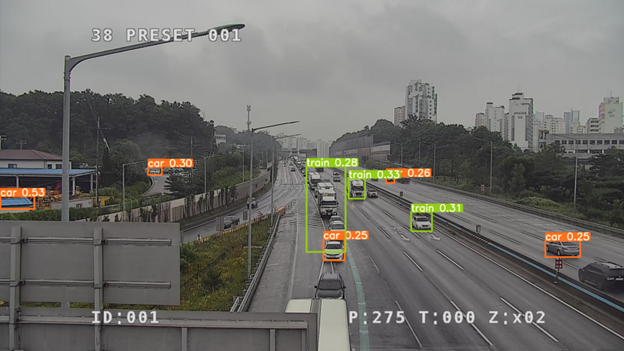
While the pre-trained model did a pretty good job in detecting and recognizing vehicles, it missed a lot of vehicles in the back. Even worse, in some cases, it recognized a row of cars as a train as in the below example. Ouch!
Train a Vehicle Counting Model
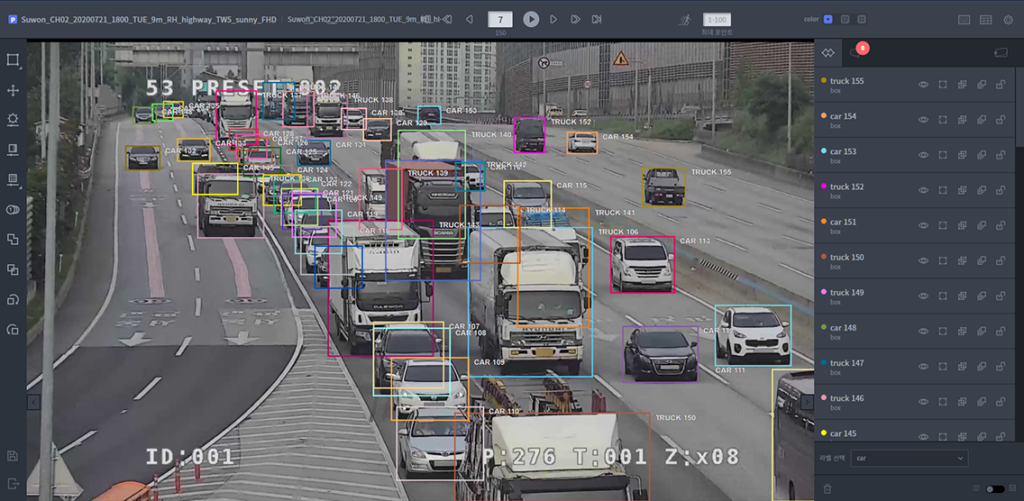
To enhance the pre-trained model, we need some labeled data. AI Hub is a public dataset repository in Korea and we can find a labeled highway image dataset from a surveillance camera. The whole dataset contains 500,000 images. For an illustration purpose, let’s just use the sample dataset that has 100 images labels. The same sample test image shows the target labels that YOLO V5 missed:

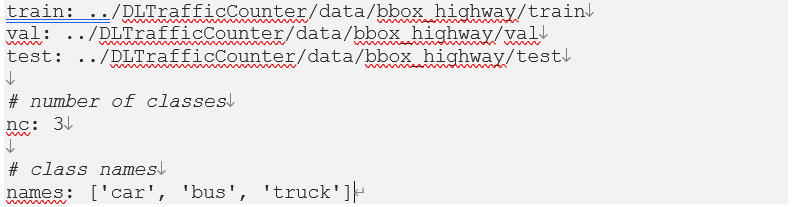
To train the YOLO model, we need to configure a few things. The most important thing is the label format and the train configuration file. Let’s look at the configuration file first. This file must contain the datasets you want to use (train, validation, and test data folders), the number of classes, and the class names. Since our purpose is vehicle counting, there are only three vehicle classes. Here is the entirety of the train configuration YAML file.
Second, for each image file, there must be the corresponding *.txt file with the same file name. In each label text file, the labels must be of the following format:

- The first number is the class id. The id refers to the index in the class names list in the training configuration file. In this case, 2 means ‘truck’ which is index 2 in the list.
- The next two numbers refer to the x and y coordinates of the image center (x and y center).
- The last two numbers are the width and the height of the label.
- Note that all numbers except the class id are normalized between 0 and 1. For instance, if the image size is (1920, 1080) as in our case, the actual coordinates should be scaled back to: (0.62772×1920=1205.22, 0.58336×1080=630.03, 0.02264×1920=43.47, 0.0359×1080=38.77)
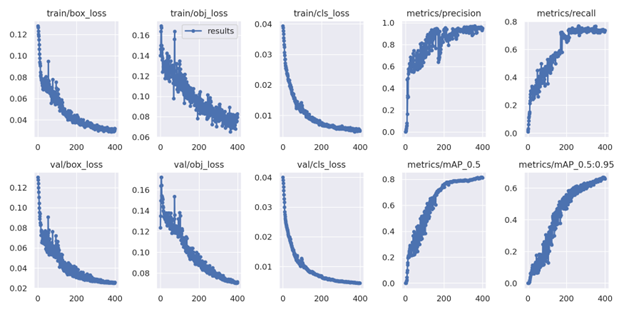
Based on this information, the annotation files are generated and put in the same folder as the training image files. Now let’s run the training script to train the model. We are using 400 epochs with 10 images per batch.

A sample training run looks like the following:
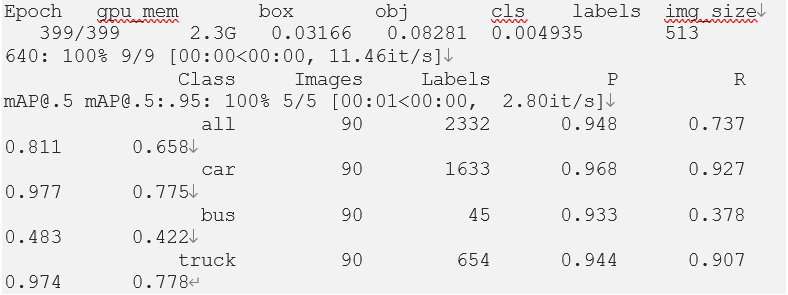
The best model (best.pt) and the last model (last.pt) are saved under ‘runs/train/exp/weights’ folder unless ‘nosave’ option is specified.
Detect and Count
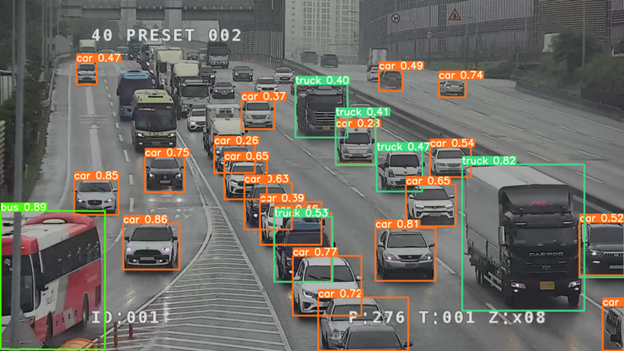
Running against the same test image, we now get quite a different result. It seems to have detected all the vehicles.
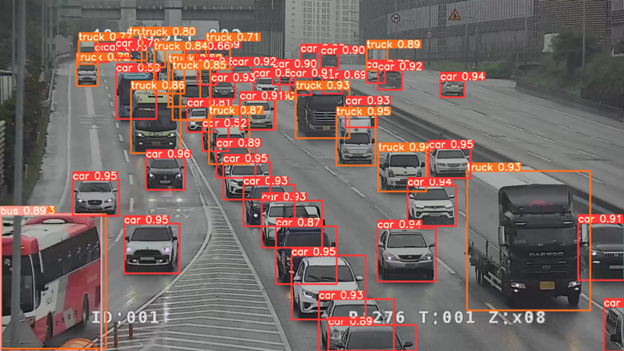
How about the trains on the highway? Nope. They are gone and replaced with detected vehicle types.
To see whether the newly trained model correctly detected all vehicles, let’s actually count vehicles for each type in the test images and tally them up. To do so, we need to parse the detection results returned by the model.
The detection results returned by YOLO contains the following information that is useful for our purpose:
1. results.names contain the names of classes: e.g., ‘person’. There are 80 of them by default corresponding to 80 COCO dataset classes including car, bus, and truck
2. results.xyxyn: xy coordinates followed by the confidence and the class id. For instance, the first item is class_id=0 with 90% confidence which refers to the ‘person’ class
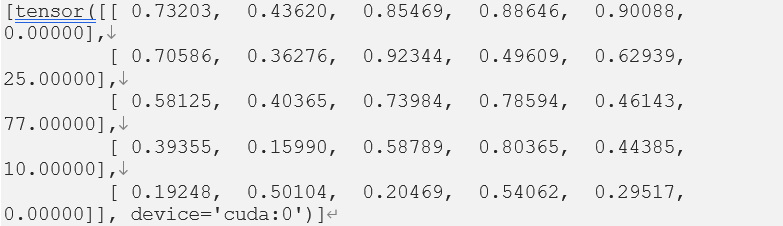
3. results.imgs is the labeled image containing the detection results.
4. results.save(‘folder’) saves the detection result image to the folder.
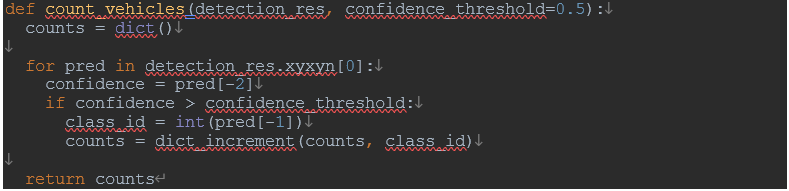
Here is the code snippet that counts vehicles per type:
Using the counting code, let’s compare the custom trained highway vehicle detection model against the YOLO pre-trained baseline model together with the ground truth:
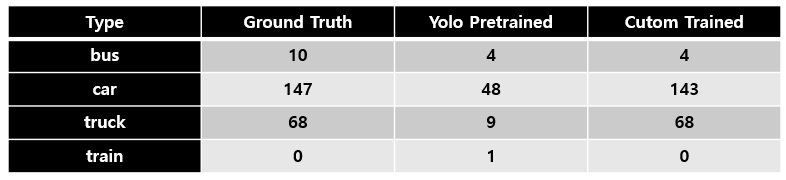
We can see that the custom model did quite well with just less than 100 images. Nice!
Conclusion
Are we done yet? Sort of, except that the model will over-count if it is processing a stream of video images. To correctly count, you need to track vehicles across different frames. This problem requires a different article. A different problem is that the current model is biased towards a dataset from a fixed position of a highway surveillance camera whose images are taken during the day. To make the model more robust, you need to train it with more diverse datasets. But now you know how to do it. Thanks for reading.
Reference
- Source code for converting and generating YOLO V5 formats as well as all other plotting functions can be found in this Colab notebook.
- The sample dataset used came from AI Hub dataset number 30743. The converted YOLO annotation files are found in this git repository.